Googlebot activity
Googlebot is the web crawler Google uses to discover content on the web. The way Googlebot interacts with your site can indicate the health of your site, particularly during an HTTPS switch (or other site-wide changes).
This article discusses how to keep track of Googlebot behavior on your site by using the crawl stats report in Google search console, and outlines expected Googlebot behavior during a typical switch from HTTP to HTTPS.
Monitoring Googlebot behavior
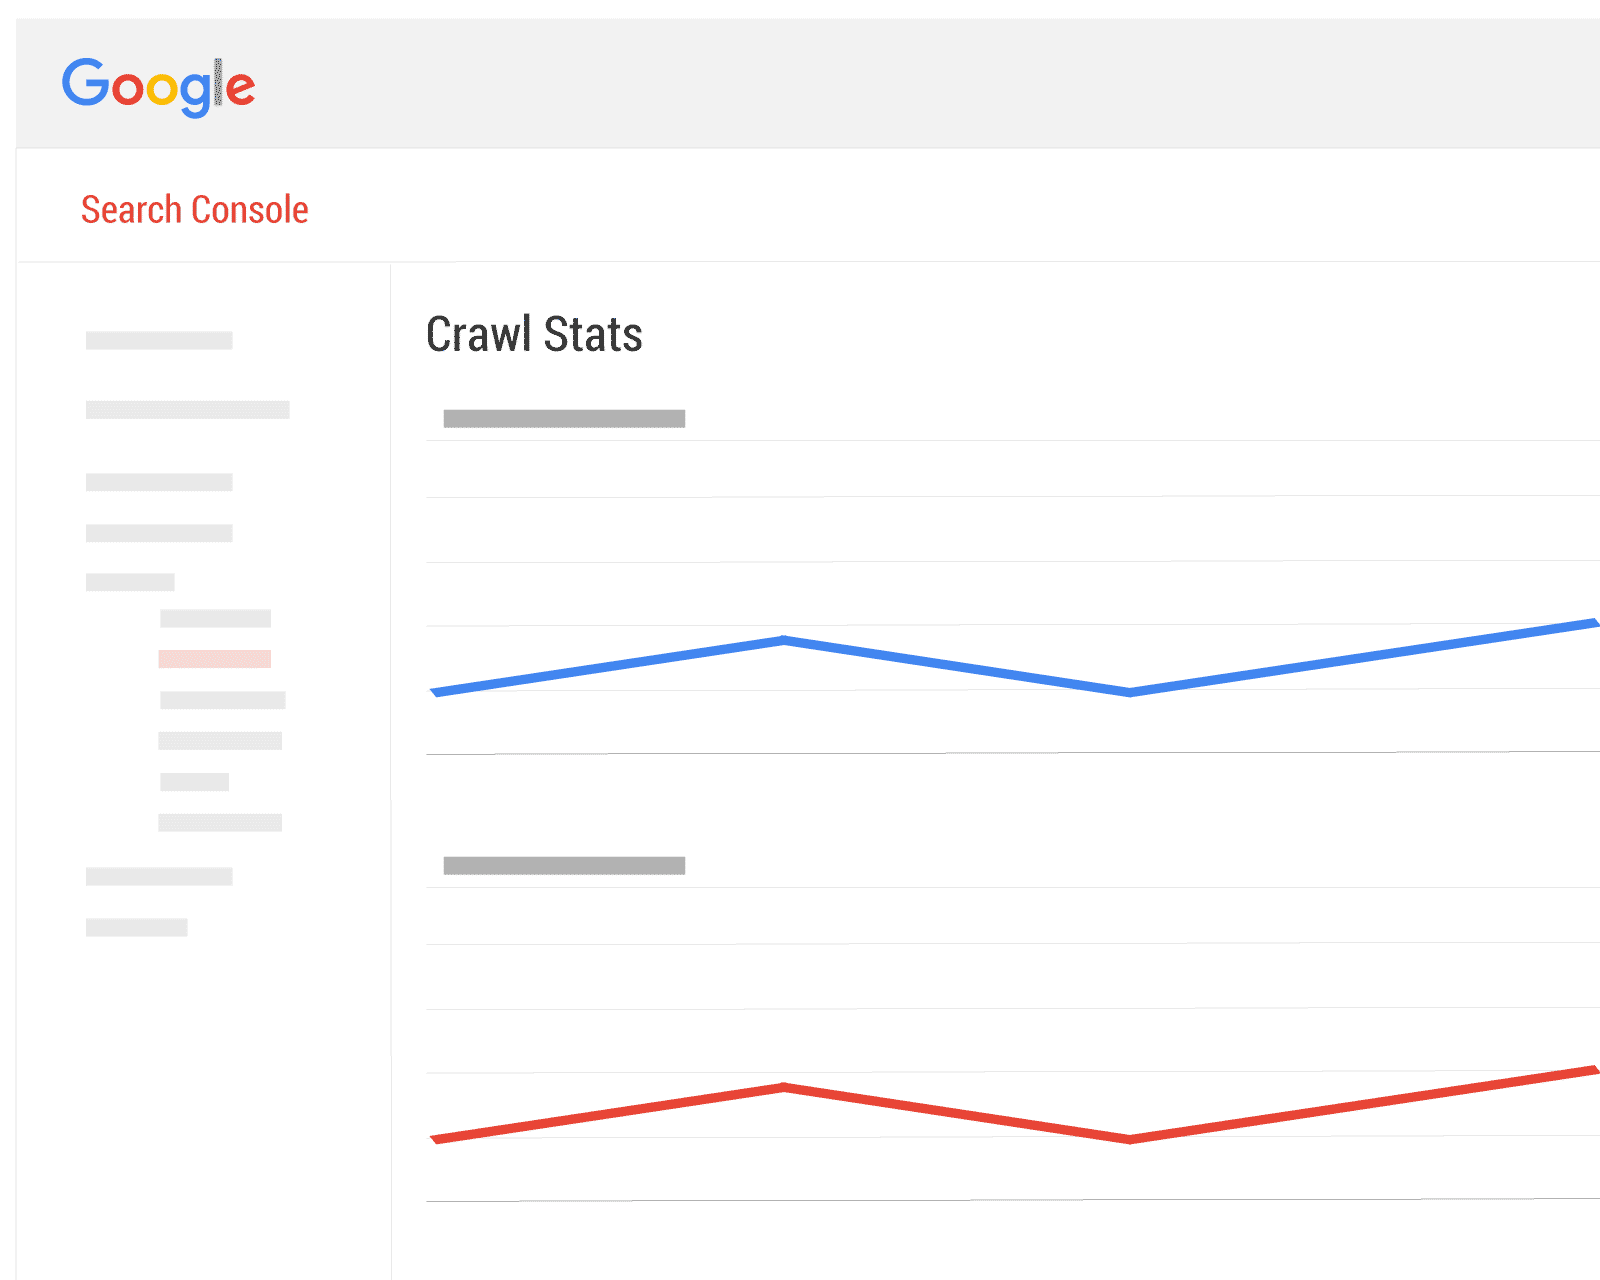
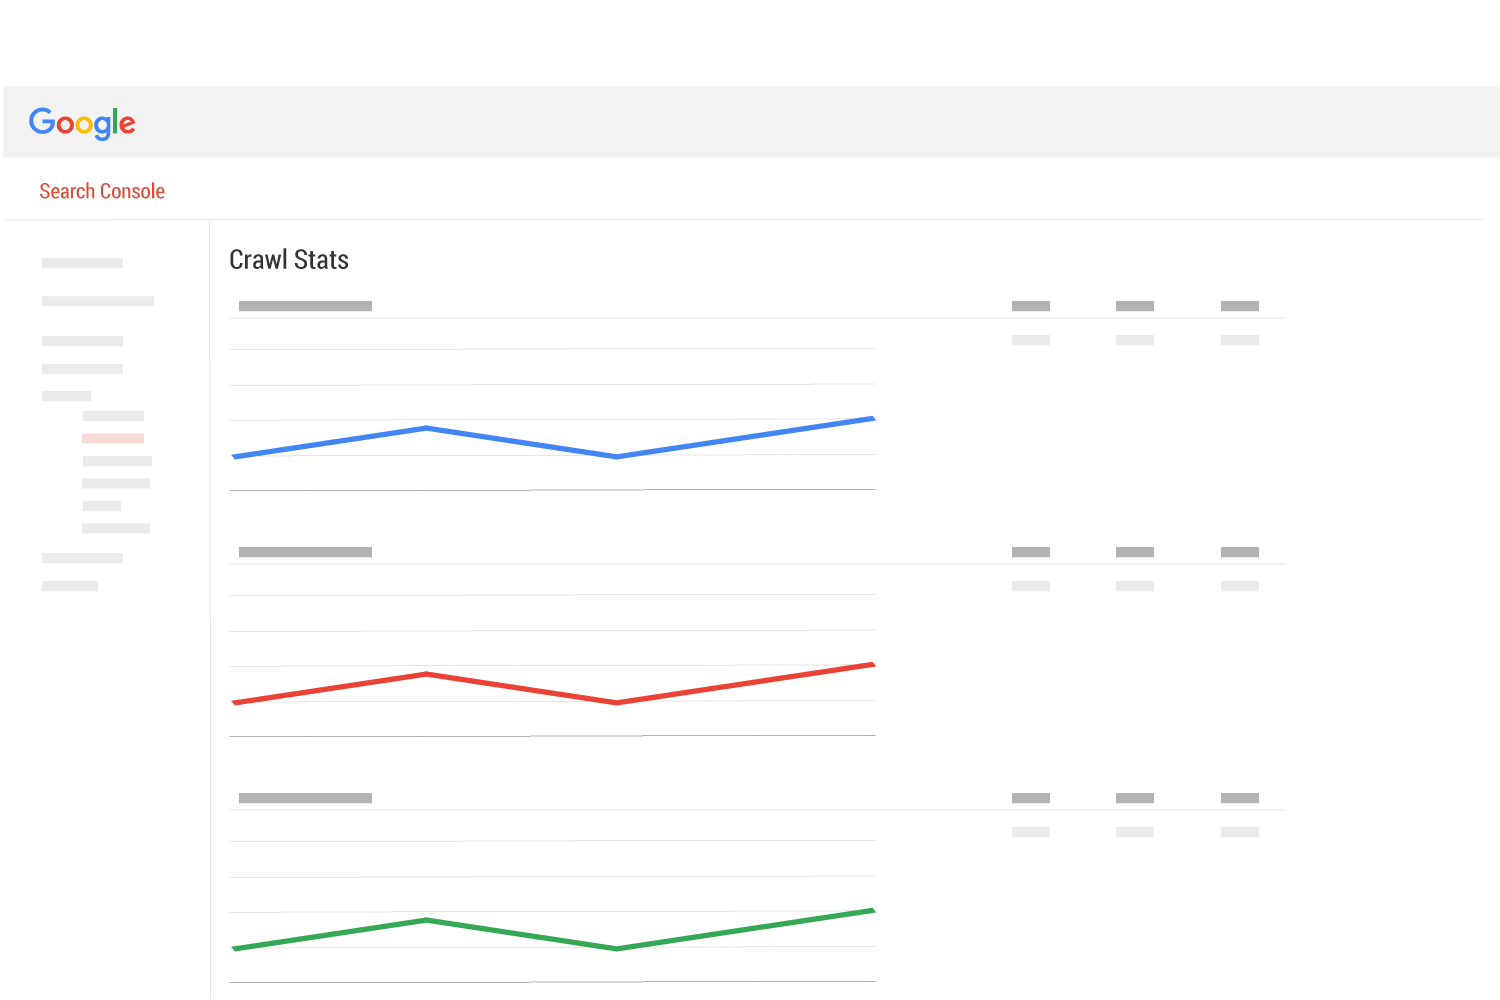
Google Search Console has a report called “Crawl Stats”. This report shows three graphs that represent different aspects of Googlebot interacting with your site for the latest 90 days.
This report is often overlooked, but can be an informative snapshot of Googlebot behavior that reveals a great deal of information. The reason I think this report is underutilized is because Googlebot behavior doesn’t change much over time, especially in a normal day-to-day situation for most websites.
When you go from HTTP to HTTPS (or any other site-wide change to your URLs), Googlebot starts doing all sorts of things and the “Crawl Stats” report becomes very exciting as dramatic changes in Googlebot behavior can be seen.
Take a screenshot before your HTTPS switch
Before switching to HTTPS (or making other such site-wide changes) it is a good idea to take a screenshot of your Google search console Crawl Stats report. Googlebot activity is only reported for the last 90 days, so it can be useful to have a snapshot of how Googlebot was acting before your changes.
Dramatic vs. stable Googlebot activity
This article will mention “dramatic Googlebot activity” or “stable Googlebot activity” quite a few times, so let’s define those terms.
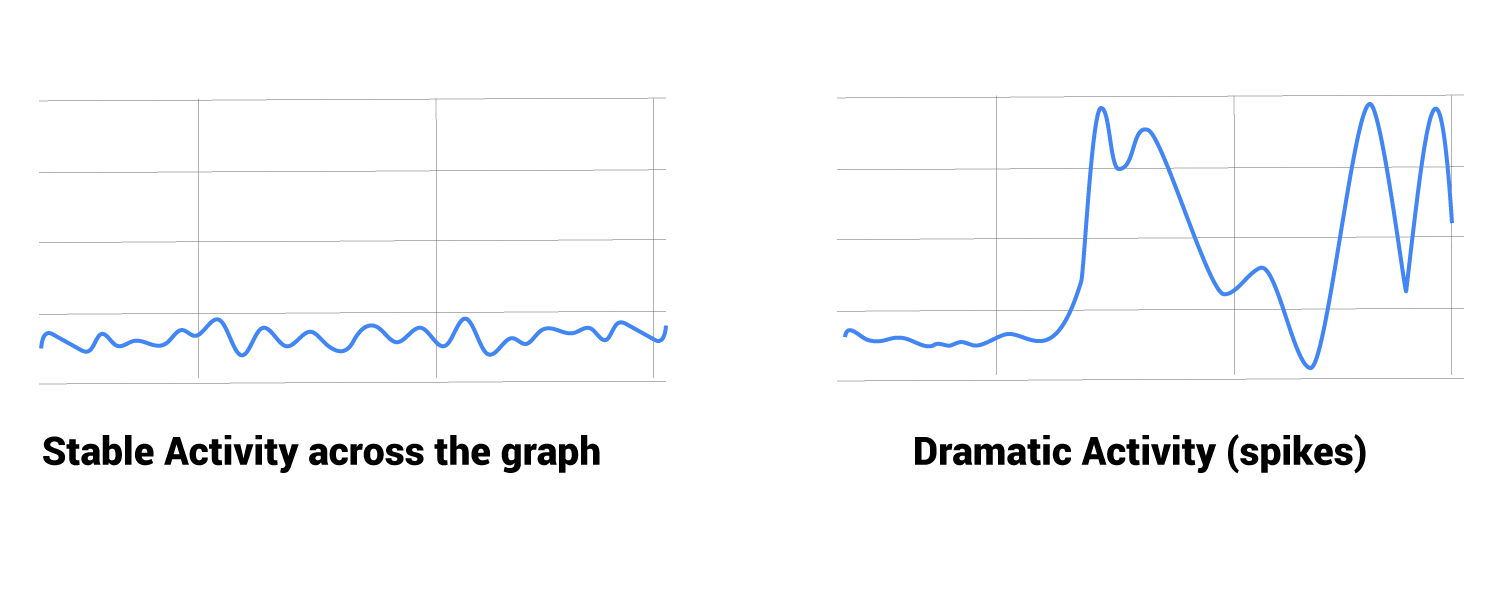
Dramatic activity
Dramatic activity brings significant spikes to the graph. An example would be that you have a 10-page website and the Googlebot Crawl Stats page shows Googlebot crawling 1000 pages. It is pretty easy to spot on the graph. There are big, giant spikes that are significantly larger than other activity.
Stable activity
Stable Googlebot activity is when there are no large spikes seen. However, it should be noted that if your website does not have many pages, you may see spikes, but they will be of similar magnitude over the 90 days reported.
How Googlebot normally behaves
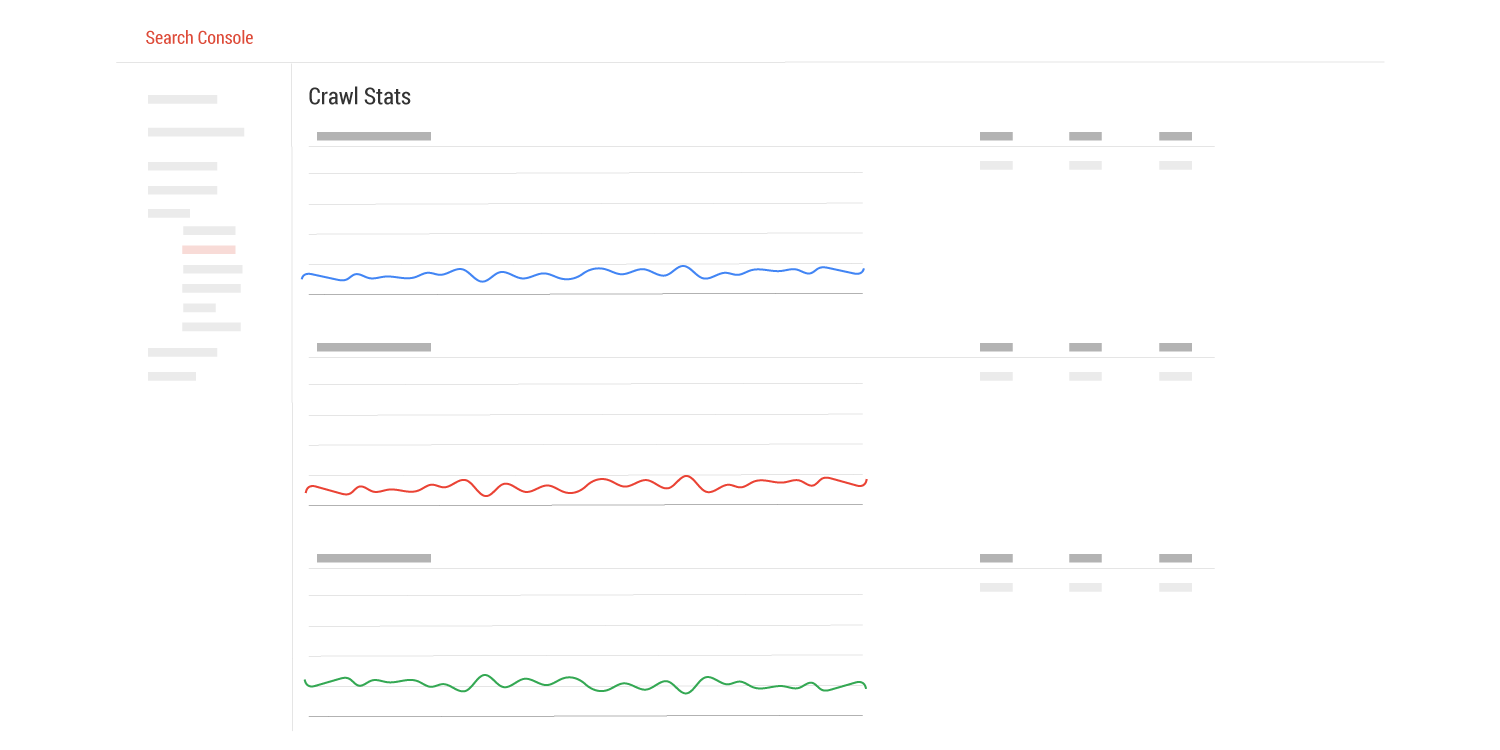
Below is an image that represents a pretty typical Crawl Stats report showing steady Googlebot activity. It isn’t very exciting. There isn’t much changing over the last 90 days.
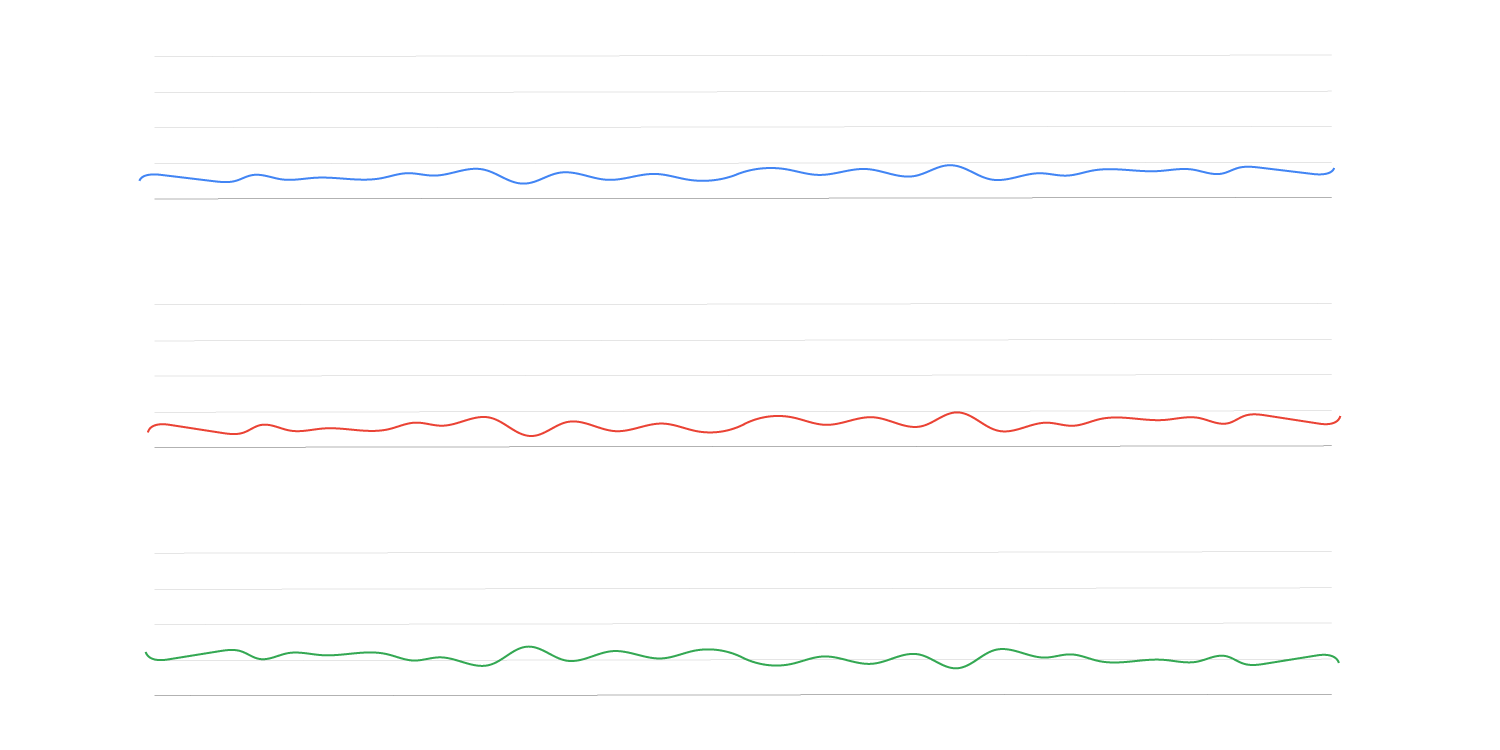
Now, even though this doesn’t seem to tell us much, it is actually saying more than you think.
When Googlebot activity is somewhat constant and stable this tells us a few things:
1. Googlebot is visiting every day
Seeing that Googlebot is visiting your site every day is a great thing. This means that it is discovering your site every day on its travels.
2. Googlebot isn’t seeing large-scale changes in your site content
Anytime a large site change is detected by Googlebot it will start visiting your pages more and it will result in some spikes in the graph. I explain that more below, but for the moment lets just say that not having giant spikes in Googlebot activity tends to indicate that no sitewide changes are occurring with your content. If you see unexpected changes in Googlebot behavior, such as large dramatic spikes, it may be worth investigating. Hacked sites, as an example, will often see dramatic spikes in Googlebot activity.
3. Googlebot isn’t discovering issues with your site structure
Low Googlebot activity is an indication that nothing really strange is going on with your internal linking or site structure. An example would be that if someone made a big mistake with your CMS that changed or removed your internal linking, it would likely result in significantly increased Googlebot activity.
4. Your web server is loading files at a somewhat constant rate
One of the three charts in the Google Search Console Crawl Stats report shows “Time spent downloading a page”. If you notice spikes here, it can indicate issues with your server. This is an important thing to watch for after an HTTP to HTTPS switch.
Steady Googlebot behavior is typically a good thing
Non-dramatic and steady Googlebot activity is the normal behavior for a site that doesn’t change very much. Even for sites that are updating content, the overall trend will be steady and predictable activity.
According to the Google help documentation…
There’s no “good” crawl number, but you should see a relatively even chart that increases over time as you increase the size of your site” … “In general, your Google crawl rate should be relatively stable over the time span of a week or two”
What makes Googlebot activity go up?
Common reasons for large upward spikes in the graphs representing Googlebot activity:
Discovery
The typical reason for spikes in Googlebot activity is the discovery of new content, links and/or URLs. When Googlebot finds new content it will often reassess the things around that new discovery.
As an example, if a new page is added to a website, Googlebot will notice it and crawl it. That page is new, so that means there is a new URL that likely didn’t exist before, and within that content found at that URL there are probably links that did not exist before either. This is basically a Googlebot perfect storm (new content, new links, new URL). Once it crawls all the new things, it will often “sniff” around just a bit to make sure it has everything.
Then it will calm down and activity will drop again.
Sitewide changes
If you are changing any aspect of your web pages across the entire site (like a new logo or a new footer) then Googlebot will go into overdrive and start heavily crawling your website. As Googlebot discovers one updated page after another it will essentially go into deep dive mode and recrawl virtually every aspect of your website. It does this because the more and more pages it finds on your site that are changed, the more it will “sniff” around for more changes. This is where the big dramatic spikes are seen on the graph.
Googlebot activity when switching to HTTPS
When you switch to HTTPS, it is important to realize that this is a change of literally every URL on your website.
So a switch from HTTP to HTTPS is most definitely a “site-wide change” and will absolutely result in a massive increase in Googlebot activity.
Crawl Stats report graphs
In the Google Search Console Crawl Stats reports, there are three different graphs (pages crawled per day, kilobytes downloaded per day, and time spent downloading a page).
Let’s explore what a typical HTTP to HTTPS switch will look like in each:
Pages crawled per day
Below is an example of what a successful HTTP to HTTPS looks like after a couple of weeks in the “Pages crawled per day” graph:
Expected behavior:
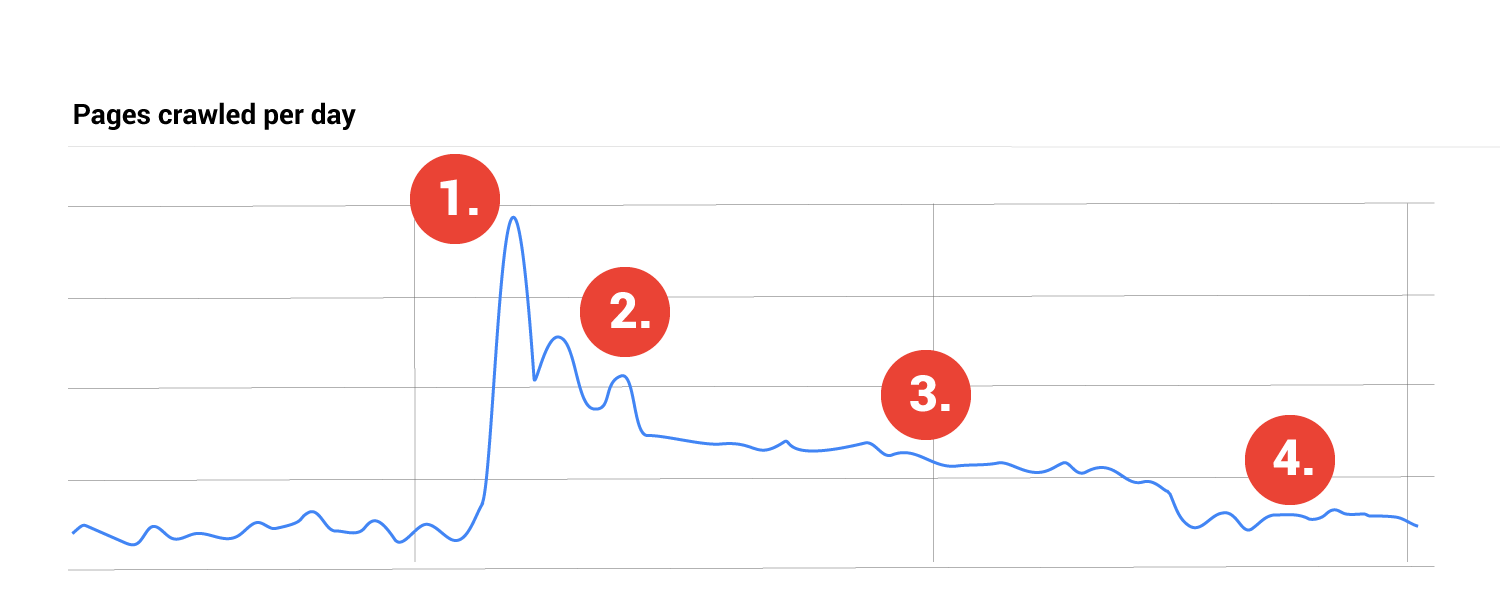
- Massive initial spike
- A couple other large spikes but smaller than the first spike (but still significantly elevated activity)
- Elevated level of activity showing a gradual reduction
- A gradual resumption of the earlier stable activity
The pages crawled per day graph displays how many pages Googlebot crawled daily, but it also gives a great overall understanding of the volume of Googlebot activity on your site. Unlike the other two graphs which speak to measurement in time and kilobytes, the pages crawled per day tells us at a glance the trend of Googlebot activity on a domain. During an HTTPS switch, there will a great deal of activity which will, over time, settle back down.
Kilobytes downloaded per day
Below is an example of what a successful HTTP to HTTPS looks like after a couple of weeks in the “Kilobytes downloaded per day” graph:
Expected behavior:
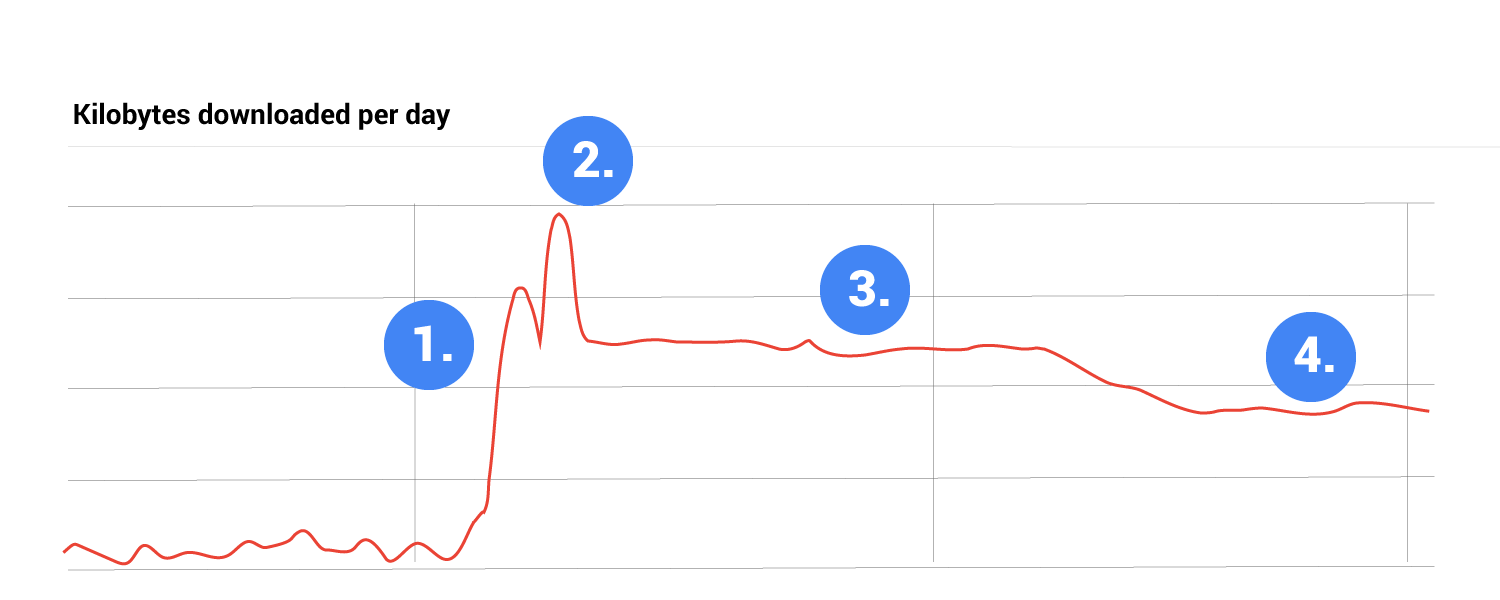
1. A large initial spike
2. A massive spike that is often larger than the initial spike/spikes
3. Greatly elevated level of activity not showing much of a reduction
4. A very gradual reduction over time
The kilobytes downloaded per day graph represents a sense of how much data Googlebot is collecting.
After an HTTPS switch, this graph won’t always “calm down to normal” as quickly as the other graphs because before the switch most of your webpages and resources were cached. Googlebot does not normally “download” things that have not changed. If Googlebot visits a page and detects that it already has the latest version, it will not actually download the page.
When you switch to HTTPS, all your URLs will change, and Googlebot will consider these all new resources and will need to actually download all the pages, resource files, and images it encounters on your entire domain. This means that there will be a great increase in the amount of data it is downloaded. That increase will continue for a while after a site-wide change of URLs (such as an HTTPS upgrade).
Time spent downloading a page
Below is an example of what a successful HTTP to HTTPS looks like after a couple of weeks in the “Time spent downloading a page” graph:
Expected behavior:
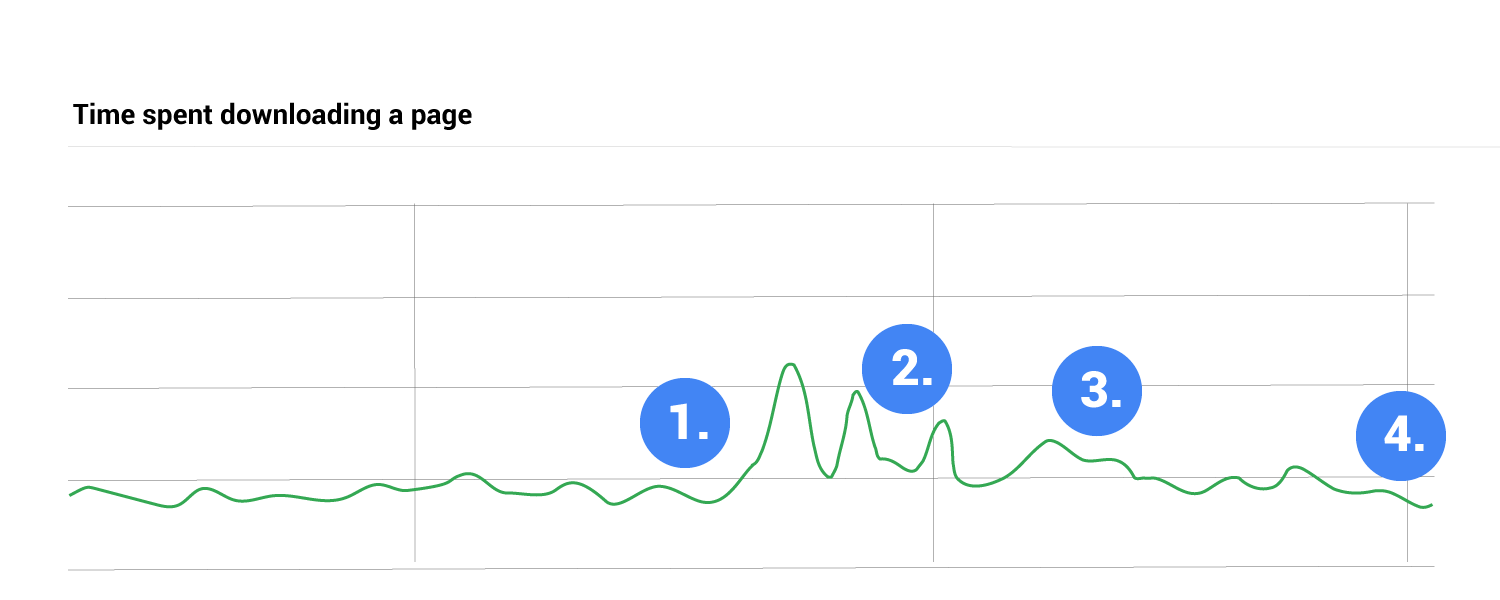
- Upward but not massive spike
- Some random spikes, but not too large
- A gradual reduction
- A return to activity similar to before the HTTPS switch
The “Time spent downloading a page” graph represents a sense of the amount of time taken to retrieve data from your server.
After an HTTPS switch, depending on how optimized your HTTPS setup is on your server, you will hopefully experience what is shown above (a return to similar behavior at the end).
If instead, you are seeing larger and larger spikes and a noticeably elevated line on the graph after your HTTPS switch, that means your server is likely not handling your HTTPS well.
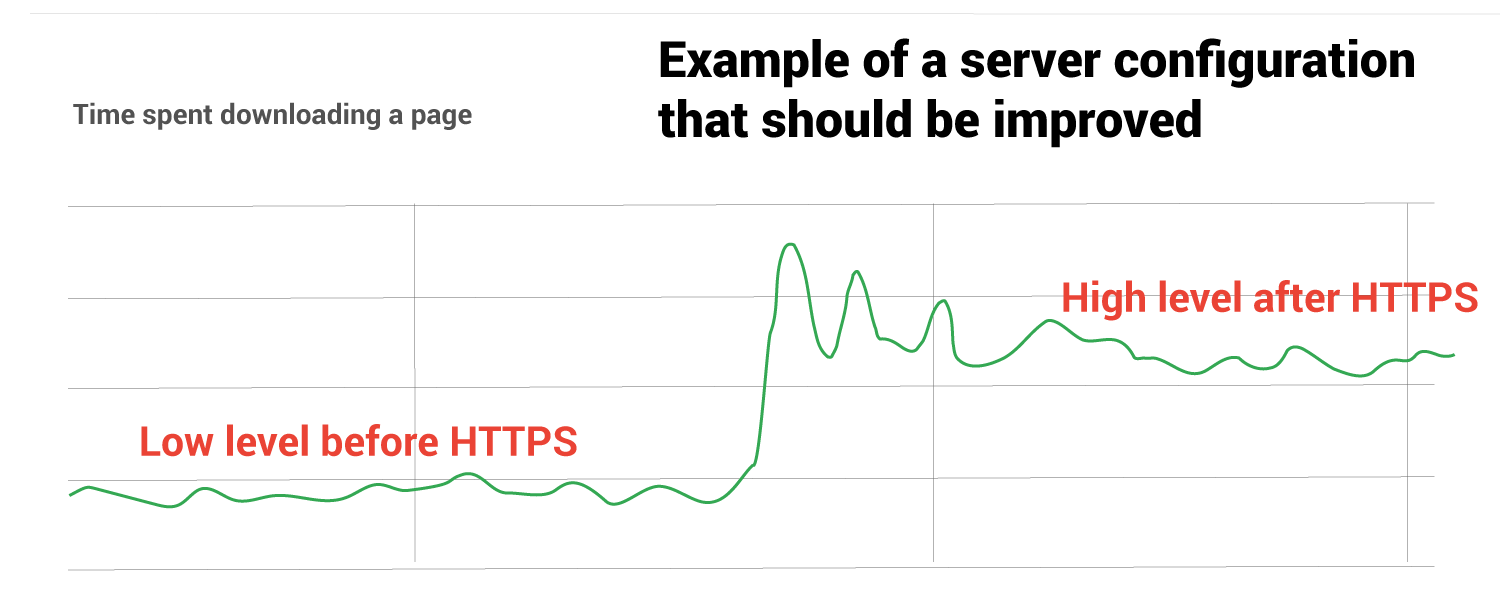
In this scenario, you want to optimize your server settings to better handle the new responsibilities that HTTPS brings to a server.
Googlebot behavior on your website is worth monitoring and recording
Near the beginning of this article, I mentioned that you should take a screenshot of your Crawl Stats report in Google Search Console. I am going to repeat that advice here.
There really is nothing better than to have occasional records of Googlebot activity at your disposal.
If you are switching to HTTPS or planning to make any other major change to your site, go to Google Search Console and take a screenshot of the Crawl Stats report.
The report only shows the last 90 days of Googlebot activity and that 90 days goes by fast when you are making big changes to your website.
See more of our HTTPS articles